Reading Graphs
Readings graphs have a colour coordinated legend to help you identify which sensor each line of the graph is referring to.
For simple graphs, the graph is a standard 2 axis line graph.
 Time Period Adjustment
Use the +/- buttons to view a smaller or longer time period.
Use the back/forward buttons to view an earlier or later period.
These buttons allow you to browse the history of sensors without having to manually enter the time period for each graph.
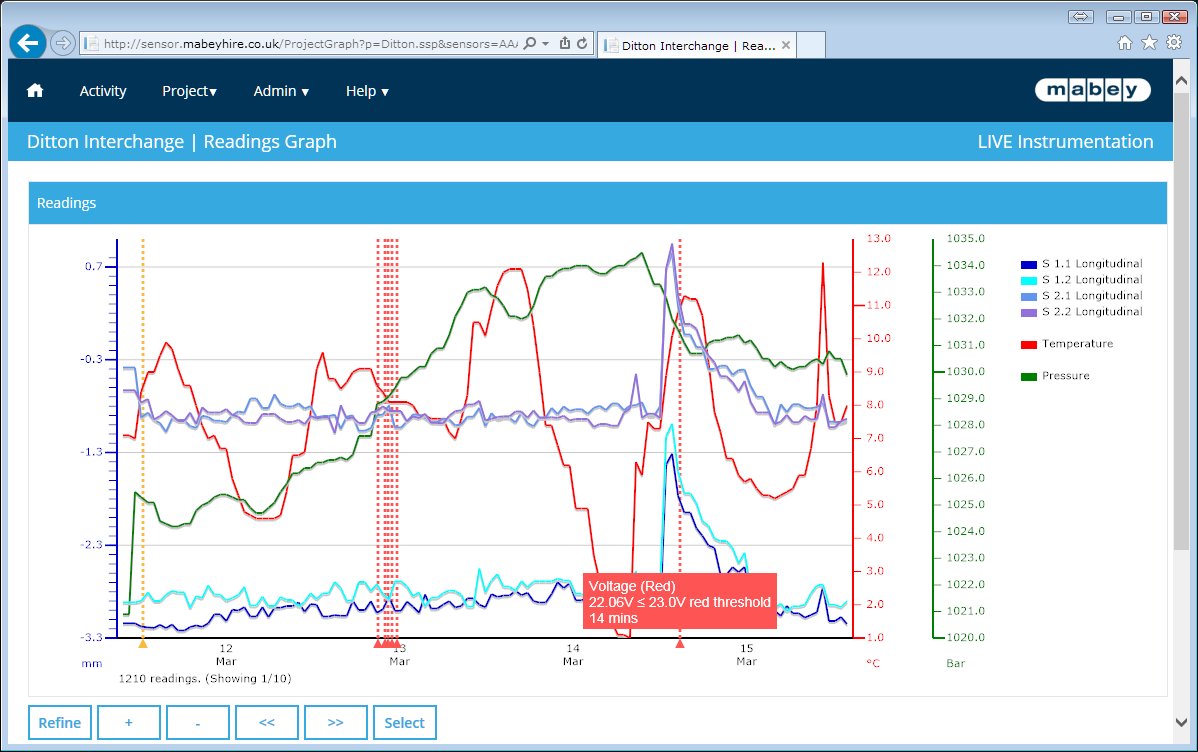
Multiple Axes
If you select to view a graph of sensors which have more than one type, the system will automatically introduce additional vertical axes.
Each vertical axis is colour coordinated and labelled separately.
The system supports up to 3 separate vertical axes. If multiple sensor types are in a single axis, the unit will not be displayed for that axis as there are multiple possibilities.
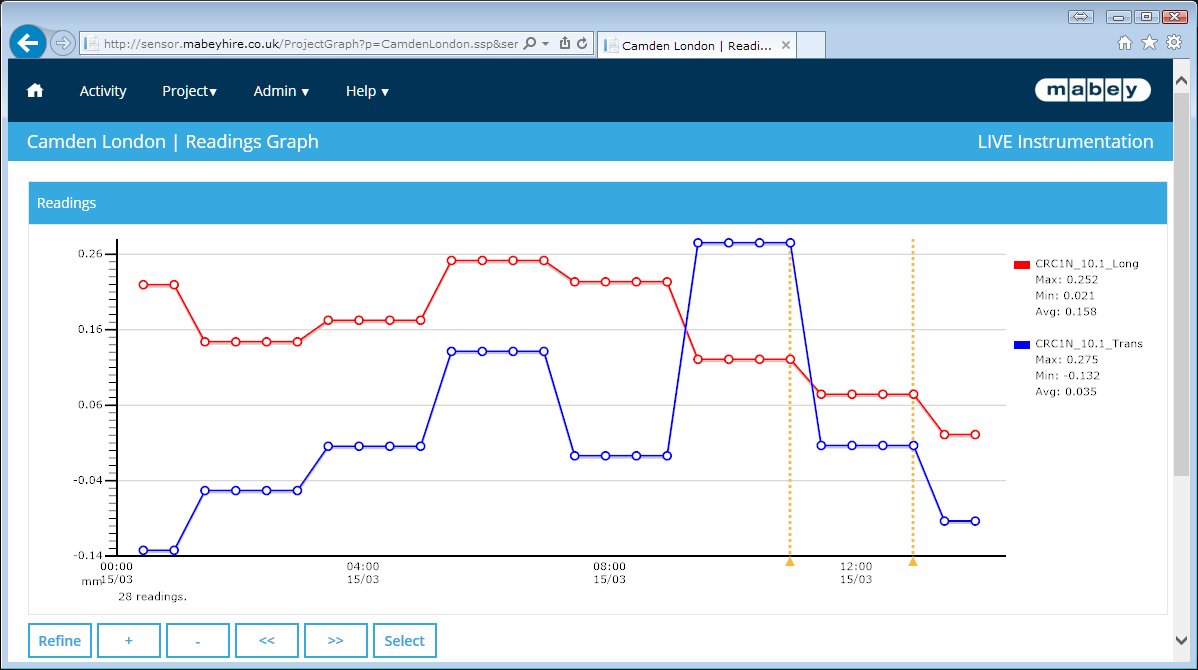
 Individual Reading Markers
When only a few sensor readings are displayed in a graph, individual readings are circled for clarity.
These circles are not visible when many readings are on the graph and it would not be possible to see all the readings individually.
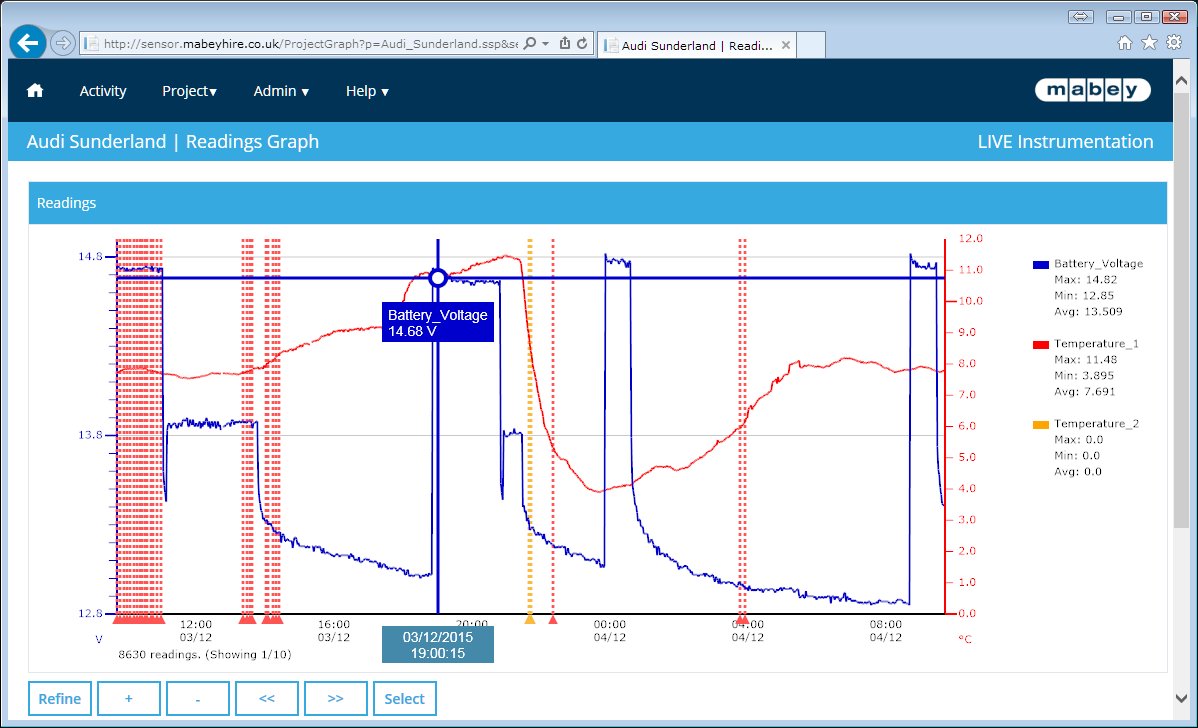
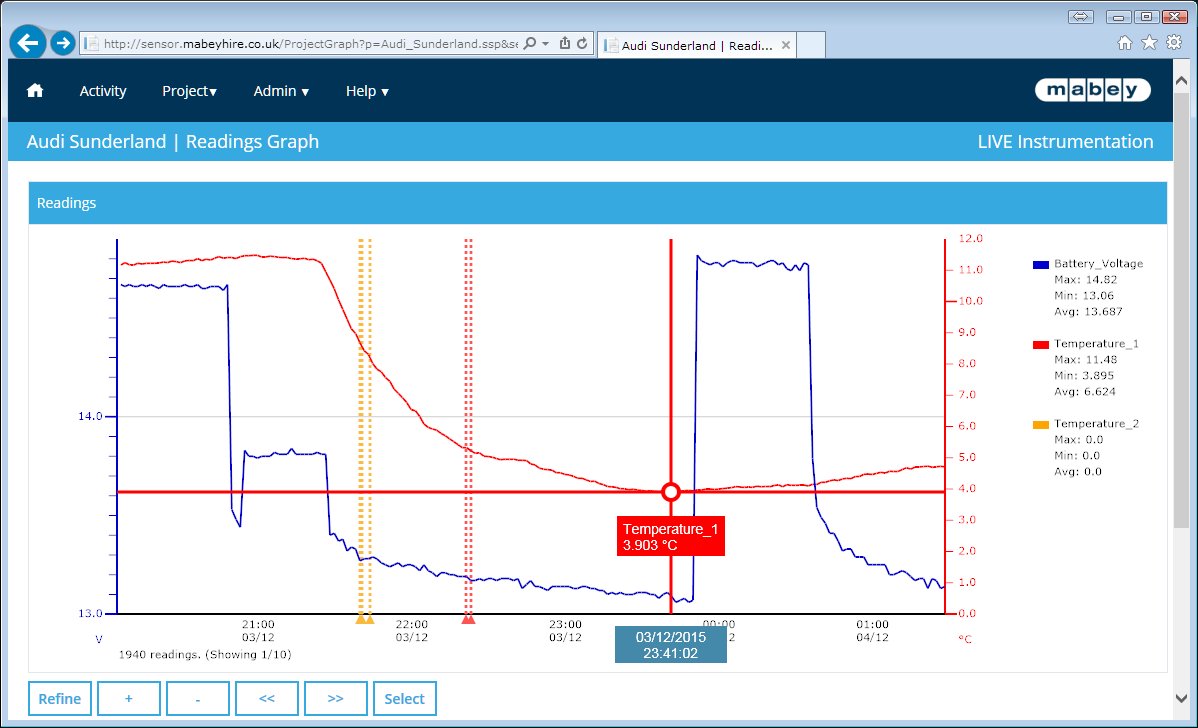 Cursor/Touch reading popup
When viewing complex graphs, move the cursor over the graph (or touch in the required position on tablet devices) to view the exact reading/time and sensor at any point on the graph.