Live Page
The Live Page is a Web page application which automatically updates.
You do not need to click refresh on your browser.
 Status Bar
The status bar section of the Live page shows the current system time and how long until the next automatic refresh in seconds.
If enabled for the project, it also shows indicators for WIFI signal strength, CPU usage, disk usage and Battery Level.
Wifi, CPU, Disk and Battery levels are for the on-site client computer, not the web server, or the computer/device on which you are viewing the Live page.
The Battery Level indicator is usually for PSU being used to supply the on-site computer.
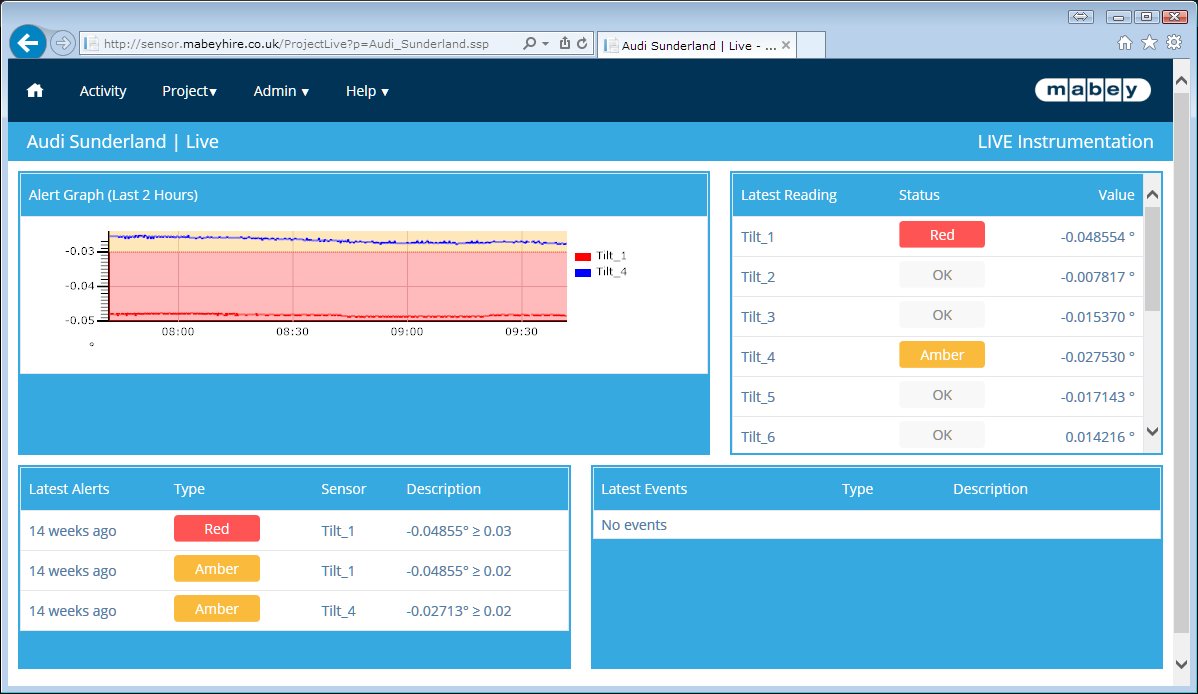
Alert Graph
The Alert Graph section shows a graph of all sensors which are currently triggering alerts.
The graph shows readings for each sensor which triggered a Threshold, Sanity, Flatline or Jitter event for the last 8 hours.
Latest Readings
The Latest reading section shows the latest reading values for all project sensors.
You can scroll through this list to see all the sensors. If a sensor reading is over an enabled threshold it will be indicated in Red/Amber/Green box colour.
Similarly it also shows if a reading is Invalid or Insane.
An invalid reading usually means there was a device reading failure and LIVEsite was unable to take a reading.
An Insane reading indicates an unexpected reading greatly outside the anticipated range of values.
Latest Alerts
The Latest Alerts section shows the latest alerts for the project.
Click on the time for an alert to go directly to the Alert page for that alert.
Latest Events
The Latest Events section shows the latest Site Work or notes for the project.
This is useful for seeing if on site work possibly caused a current alert.
Click on the time for an event to go to the relevant Event page.